Configuring the Clearance dashboard
2022-02-17Last updated
After you have created some cases assigned them to the correct categories, you can configure the Clearance dashboard.
What you should know
Procedure
To date section: This section gives an overview of
data added since the creation of the account. Total data storage is can be organized
by category or state.
-
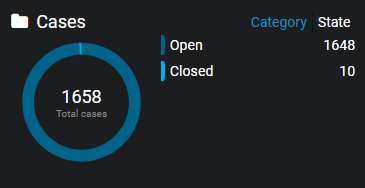
In the Cases section, examine the types and status’ of
investigations that your organization has handled using Clearance. Organize total cases by:
- Category
- State
-
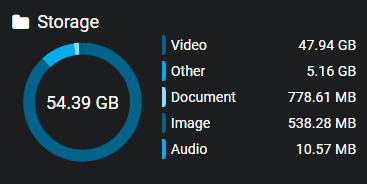
In the Storage section, you can assess how your
organization has used storage between the following media types since the
creation of your account:
- Video
- Document
- Image
- Audio
- Other
-
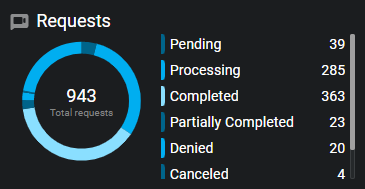
In the Requests section, you can examine the total number
of requests, organized by request status, that your organization has handled. It
can be an indicator of the overall health of your organization’s request
process. Examine requests by the following status':
- Pending
- Processing
- Completed
- Partially Completed
- Denied
- Canceled
- Video Unavailable
Historic section: Examine these statistics and
filters give you a more detailed understanding of the data your organization has
collected.
-
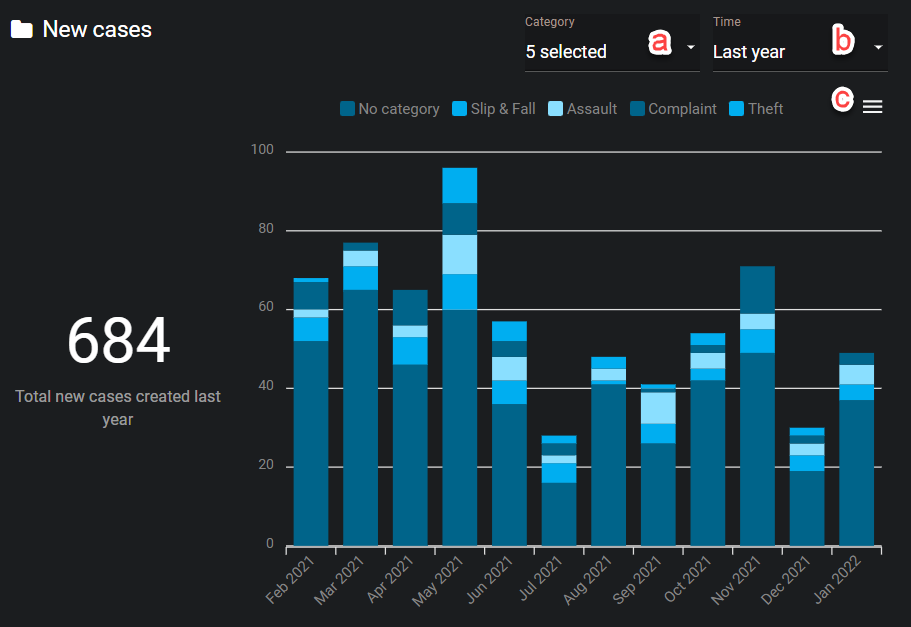
In the New cases section, gain insights into the number
and types of investigations that were created over a configurable time period.
Use this to identify trends over time related to different incident categories,
or to assist with resource allocation for future cases. Configure the following
in the New cases section:
- Optional:
If you want to download the data, click Download
(
 ) and select a file type.
- Optional:
If you want to download the data, click Download
(
-
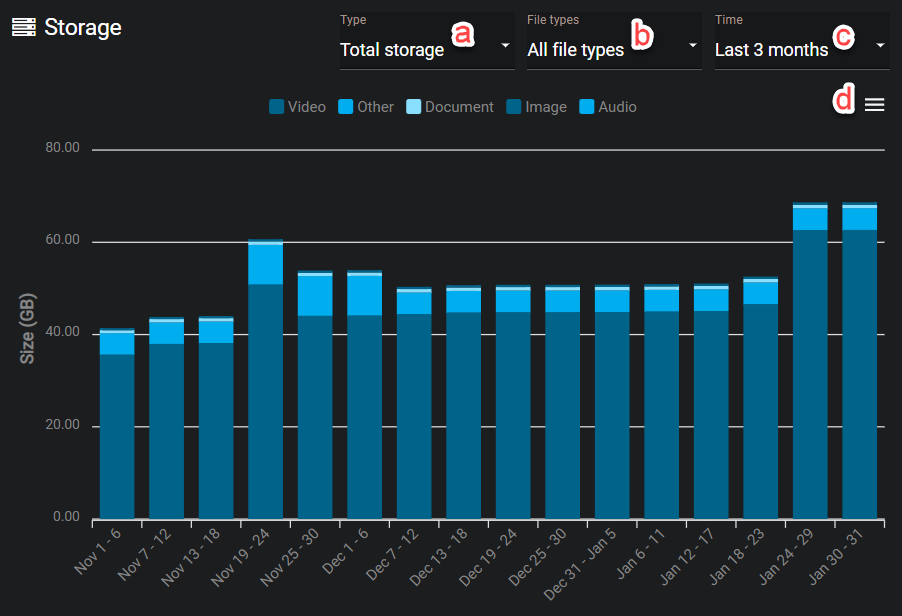
In the Storage section, discover how storage is allocated
between the different types of evidence used in your investigations. Assess your
storage needs over time and examine how much of each specific media type your
organization has added in the past week, month, or other period of time.
Configure the following storage settings:
- Click Type and select New storage or Total storage.
- Click File types and select the file type that you want to examine.
- Click Time and select the time period you want to examine.
- Optional:
If you want to download the data, click () and select
a file type.
-
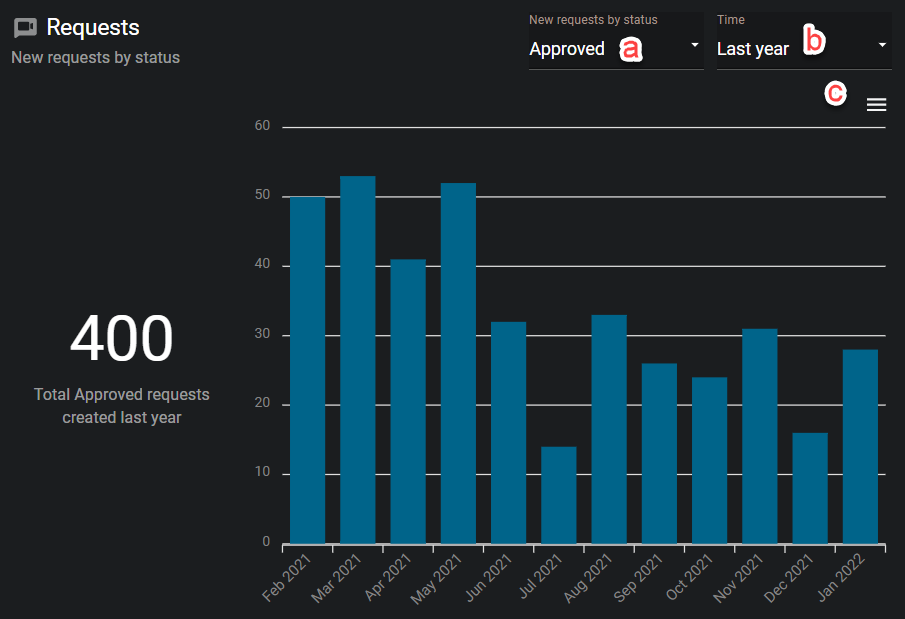
In the Requests: New requests by status section, you can
gain a better understanding of the level of efficiency of your request process.
These metrics can help your organization identify potential bottlenecks and
trends in the number of submitted and completed requests. In this section,
configure the following settings:
- Click New requests by status and select a request status state.
- Click Time and select the time period you want to examine.
- Optional:
If you want to download the data, click () and select
a file type.
-
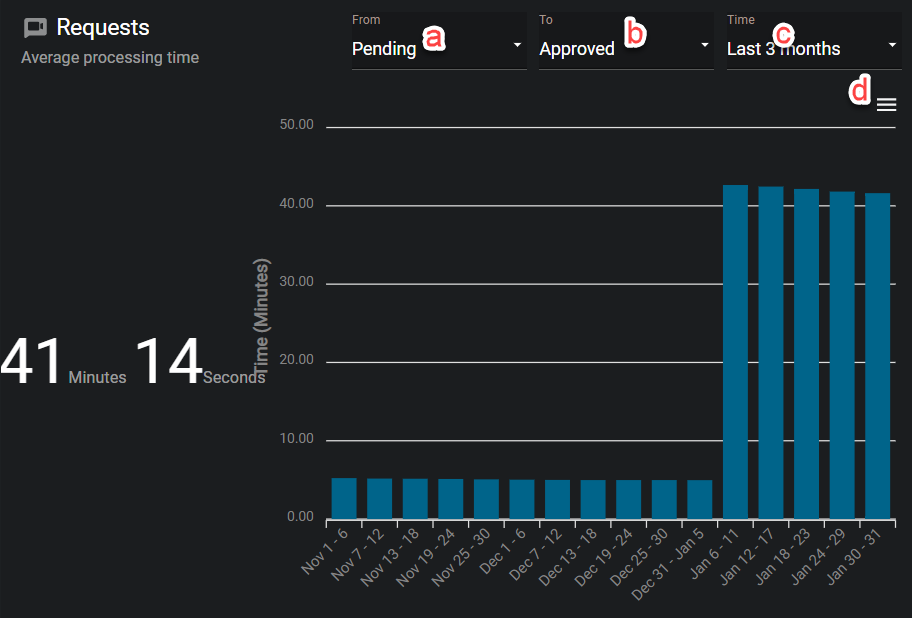
In the Requests: Average processing time section, assess
how long it takes to complete the request process and determine whether it is
improving, worsening, or remaining consistent. Configure the following
settings:
- Click From and select a starting status for the average processing time measurement.
- Click To and select an ending status measurement.
- Click Time and select the time period you want to examine.
- Optional:
If you want to download the data, click () and select
a file type.
-
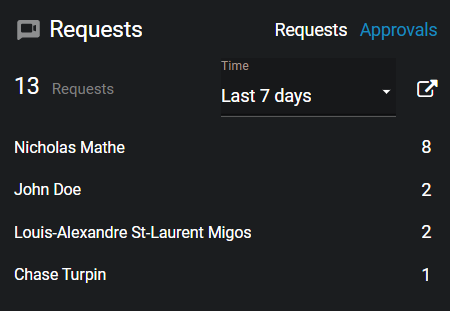
In the Requests: requests/approvals section, examine how
many requests have been submitted and approved over time by specific users by
configuring the following settings:
- Click Requests for a list of users organized by the number of requests they have made.
- Click Approvers for a list of users organized by the number of requests they have approved.
- Click All time and select the time period you want to examine.
- Optional:
If you want to download the data as a .CSV file, click (
 ).
).